
Published by Nexara Intelligence Group
https://nexaraintelligencegroup.com/situationReports/2ea7607b-8de5-4a30-84f8-bfc23e0ebeda
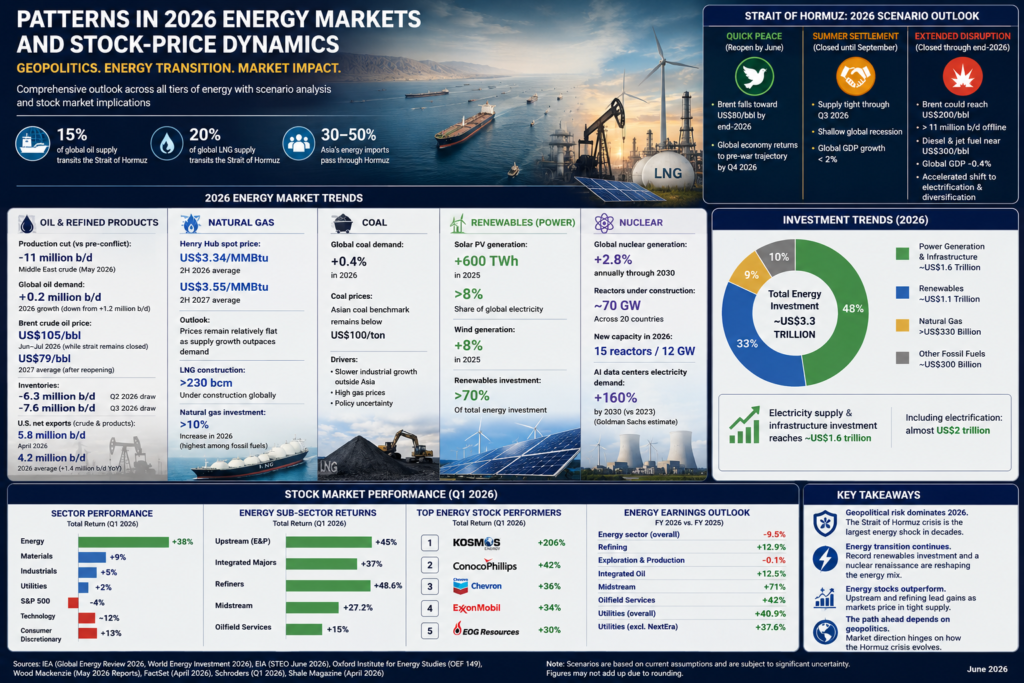
The energy world of 2026 was dominated by geopolitics. On 28 February 2026 a U.S.–Israeli strike on Iran led to a war that effectively closed the Strait of Hormuz, the world’s most important oil and liquefied‑natural‑gas (LNG) shipping channel. Daily transit through the strait nearly stopped, with the disruption affecting crude oil, refined products, LNG, fertilizers and metals. An analysis published in May 2026 by the Oxford Institute for Energy Studies described it as one of the most severe energy shocks in modern history; roughly 15 % of global oil supply and 20 % of global LNG supply was blocked. Such disruption forced markets to question long‑held assumptions about spare capacity, stockpiles and the reliability of maritime chokepoints.
At the same time, structural trends continued: solar power saw record additions in 2025, nuclear energy entered a new growth cycle, and global electricity demand kept rising. This report synthesizes publicly available information from government agencies, think‑tanks, financial research and investment houses to outline patterns across all tiers of the energy sector (oil, gas, coal, renewables and nuclear) during 2026. It also examines how these trends influenced the performance of energy stocks and presents scenario‑based outlooks for the next quarters, placing particular weight on the geopolitical situation in the Persian Gulf.
Geopolitical Backdrop: The Strait of Hormuz Crisis
Scale of the disruption
Unprecedented supply shock: The Oxford Energy Forum noted that the Hormuz closure removed about 15 % of world oil supply and around 20 % of global LNG supply from the market. Asian economies were particularly exposed because 30–50 % of their imports of crude, condensate, liquefied petroleum gas and LNG transit the strait. Physical commodity markets for middle distillates, fertilizers and LNG showed acute stress while equity markets initially appeared more sanguine.
Impaired market buffers: Analysts stressed that this was not a typical supply interruption but a shock that disabled traditional buffers such as spare OPEC capacity and commercial stockpiles. Strategic and commercial inventories were small relative to the size of the disruption and mismatched in regional location and product quality.
Forecast scenarios
Wood Mackenzie’s May 2026 report Strait Talking: Iran War Scenarios and the Future of Energy offered three scenarios for how the crisis might evolve:
Scenario | Key assumptions | Projected market outcomes |
Quick Peace | Cease‑fire achieved and the strait reopens by June 2026. | Oil supply recovers quickly: crude prices fall towards US$80 per barrel by the end of 2026. The global economy returns to its pre‑war trajectory by Q4 2026. |
Summer Settlement | Cease‑fire holds but negotiations drag on; the strait remains mostly closed until September. | Persistent shortages: oil and LNG supply remains tight through Q3 2026, causing a shallow global recession and pushing global GDP growth below 2 %. |
Extended Disruption | Conflict continues; the strait stays largely closed through the end of 2026. | Severe supply shock: Brent crude could approach US$200 per barrel by end‑2026, more than 11 million b/d of crude remains shut in, diesel and jet fuel prices could near US$300 per barrel, and the global economy could contract by about 0.4 %. Oil‑importing countries accelerate electrification and energy diversification. |
These scenarios provide a framework for evaluating the energy market and stock‑market outcomes in the following sections.
Patterns Across Energy Markets in 2026
Oil and refined products
Supply and inventories: The U.S. Energy Information Administration (EIA) assumed the Strait of Hormuz would remain effectively closed in the near term but reopen in Q3 2026. Oil producers in the Middle East reduced crude production by over 11 million b/d in May 2026 compared with pre‑conflict levels, causing large inventory draws; global inventories were forecast to drop by 6.3 million b/d in Q2 2026 and 7.6 million b/d in Q3 2026.
Demand: High fuel prices and government initiatives lowered oil demand. The EIA projected that global oil demand would decline by 1.1 million b/d in 2026 (from 104 million b/d in 2025) instead of the modest growth expected before the crisis. The decline in demand did not, however, prove to be as high. As of June 2026, the decrease has been estimated at .2 million b/d.
Prices: The EIA assumed limited shipping through the strait would keep Brent crude at an average of US$105/b in June–July 2026. Once shipments resume, Brent was forecast to fall to about US$79/b in 2027. Diesel and jet fuel wholesale prices were expected to rise more than 60 % in 2026 compared with the pre‑conflict outlook.
U.S. petroleum trade: Disruptions through Hormuz increased demand for U.S. exports; U.S. net exports of crude oil and petroleum products reached 5.8 million b/d in April 2026 and were expected to average 4.2 million b/d for 2026, up 1.4 million b/d year‑on‑year.
Natural gas
Flat prices despite demand growth: Warmer weather in May lifted electricity demand and nudged Henry Hub natural gas prices up, but the EIA forecast that natural gas prices would remain relatively flat in 2026 because supply growth outpaces demand. The Henry Hub spot price was projected to average about US$3.34 per MMBtu in the second half of 2026 and US$3.55 per MMBtu in 2H 2027.
Associated gas supply: Rising oil prices were expected to drive higher crude oil production, boosting associated natural gas output and keeping a lid on prices.
Electricity generation and renewables
Record solar growth: The International Energy Agency’s Global Energy Review 2026 reported that solar PV generation increased by 600 TWh in 2025, pushing its share of global electricity generation above 8 %. The 2025 surge is relevant for early‑2026 patterns because it shows the momentum of renewable deployment going into the crisis. Strong solar growth coincided with the first decline in global coal‑fired generation (excluding Covid‑19) since 2019.
Renewables and nuclear growth: Renewables and nuclear energy together accounted for more than the entire increase in global electricity generation in 2025, while fossil‑fuel generation fell slightly. Wind output rose by around 8 % despite poor conditions in some markets, while nuclear generation expanded by about 1.2 %, reaching a record level.
Energy demand trends: Growth in global energy demand slowed to about 1 % in 2025, down from 2.8 % in 2024, partly because of strong renewable generation and cooler weather. China’s energy demand growth slowed to 1.7 %, while U.S. demand accelerated to over 2 %, partly due to gas‑to‑coal switching and increased electricity use by data centres. Electric vehicles and data centres were rapidly increasing their demand for electricity.
Coal
Demand moderation: Coal demand grew only 0.4 % in 2025, reflecting declines in China and India as renewables squeezed out coal generation and cooler temperatures reduced cooling demand. Coal generation’s share of U.S. electricity was projected to fall from 17 % in 2025 to 16 % in 2026 and 15 % in 2027. However, coal demand remained resilient in some markets in early 2026 due to higher natural‑gas prices and energy‑security concerns.
Nuclear energy
New growth cycle: The Kaizen Institute noted that the global nuclear industry rebounded sharply in 2026 after a weak 2025. Around 15 nuclear reactors were expected to come online in 2026, adding about 12 GW of new capacity. Nuclear generation is forecast to grow at 2.8 % annually through 2030, more than double the growth rate of 2019–2024. Drivers include surging electricity demand from AI‑driven data centres, energy‑security imperatives and net‑zero commitments.
Investment trends: More than 70 GW of nuclear capacity was under construction worldwide in 2025, with governments and corporations signing long‑term power purchase agreements. Small modular reactors (SMRs) were highlighted as a disruptive technology that could quadruple global nuclear capacity by 2050. China planned to bring the Linglong One SMR into operation in the first half of 2026.
Energy investment patterns
The IEA’s World Energy Investment 2026 report provided insights into capital flows:
Fossil‑fuel supply: Total investment in oil, gas and coal supply was expected to reach just over USD 1 trillion in 2026, reversing a ~3 % decline in 2025. Natural gas projects drove most of the growth as Asian energy‑security concerns spurred LNG investment.
LNG capacity: Investment in LNG export projects was expected to more than double in 2026 relative to 2025, with over 230 billion cubic metres (bcm) of capacity outside the Persian Gulf moving towards peak construction.
Power sector: Global investment in power generation rose to USD 1.5 trillion in 2025 and was expected to stay high in 2026. Renewables still accounted for more than 70 % of investment, but orders for new natural‑gas‑fired plants hit 130 GW in 2025 — the highest in 25 years — driven by U.S. data‑centre demand. Concerns over energy security were encouraging governments to invest not only in renewables and batteries but also in nuclear and coal capacity.
Energy Stock Performance in 2026
Q1 2026: Energy stocks lead amid a volatile market
The first quarter of 2026 produced some of the widest sector divergences in years. Shale Magazine reported that while the S&P 500 index finished Q1 2026 down about 4 %, the energy sector surged nearly 38 %. Tight global supply, strong refining margins and geopolitical risk drove the rally. Key observations include:
Broad‑based gains: All major subsectors participated. Upstream oil and gas producers posted an average gain of 45 %, with companies like Kosmos Energy up 206 % and ConocoPhillips up 42 %. Midstream (pipelines and transport) stocks gained 27.2 %, aided by high tanker day‑rates. Refiners were the standout within downstream, with the largest U.S. independent refiners returning 48.6 % on average. Integrated “super‑majors” (e.g., ExxonMobil and TotalEnergies) returned roughly 37 % as high prices lifted all parts of their business.
Drivers: Fundamental factors—tight supply, disciplined capital spending and record cash flows—propelled the sector. Investors rewarded companies for diversified cash‑flow streams and strong balance sheets. The rally was not purely speculative but grounded in robust earnings.
Risks: Shale Magazine warned that risks were building: a prolonged conflict could hurt demand; a global economic slowdown or higher interest rates could weigh on energy shares; and high expectations leave little room for disappointment.
Earnings outlook
FactSet’s Q1 2026 earnings preview for the S&P 500 energy sector highlighted analysts’ changing expectations. At the start of the year, the sector was expected to post modest earnings growth, but forecasts swung from –9.5 % to +12.9 % and back to –0.1 % as oil prices and corporate guidance shifted. Key points include:
Earnings volatility: The price of oil rose 77 % in Q1 2026 (from US$57.42 to US$101.38) but the average price for the quarter (US$72.67) was only 1.8 % above Q1 2025. Analysts repeatedly revised earnings estimates; by April 2026 they expected a small decline for the quarter.
Sub‑industry trends: Two sub‑industries were projected to post year‑on‑year earnings growth—Oil & Gas Refining & Marketing and Oil & Gas Storage & Transportation—while Integrated Oil & Gas, Equipment & Services and Exploration & Production were expected to decline. Excluding Exxon Mobil (whose guidance dragged down the sector), the energy sector would have been expected to show 12.5 % earnings growth.
Forward outlook: Analysts predicted earnings growth of more than 35 % for the energy sector over the subsequent four quarters, with estimated growth rates of 71 % in Q2 2026, 42 % in Q3 2026, 40.9 % in Q4 2026 and 37.6 % in Q1 2027. The Middle East conflict was expected to keep WTI crude above US$100/bbl, benefitting oil‑weighted producers.
Broader market context
Schroders’ Q1 2026 market review noted that global equities fell during the quarter; the S&P 500 declined 4.3 % as investors digested higher oil prices and the escalation of conflict in the Middle East. Energy stocks were the stand‑out performers, while technology shares—especially software—underperformed. The report underscored that the surge in oil prices and uncertainty around a prolonged conflict led to risk aversion and a sell‑off in most sectors.
Scenario‑Based Outlook for Coming Quarters
The future trajectory of energy markets and stocks hinges on geopolitical developments, supply recovery and the pace of the energy transition. The three scenarios from Wood Mackenzie provide a useful lens. The table below summarizes potential implications for energy prices and stock performance through the next quarters (Q3 2026 to Q1 2027). These are not forecasts but structured possibilities derived from published research.
Scenario (from Wood Mac) | Energy‑market implications | Possible stock‑market effects |
Quick Peace (Strait reopens by June 2026) | Oil supply and prices: Crude shipments through Hormuz resume quickly; inventories start to rebuild. EIA expects Brent prices to ease toward US$80/b by end‑2026. Diesel and jet fuel prices would also retreat from extreme levels. Demand: With prices moderating and the global economy avoiding recession, oil demand could rebound in 2027. Investment: Pressure eases on non‑Gulf producers; LNG and refinery investments continue but at a more measured pace. | Energy stocks: After exceptional gains in Q1 2026, a quick peace could lead to profit‑taking and mean reversion. Earnings growth would normalise as price pressure eases; the FactSet earnings outlook might prove optimistic. Refiners and midstream might still outperform due to resilient margins, but upstream producers could see share‑price consolidation as oil prices fall toward US$80/b. Diversified majors with renewable portfolios may fare better. Broader market: Relief rally across equities could reduce the energy sector’s relative outperformance; investors might rotate back into technology and consumer sectors. |
Summer Settlement (Strait reopens in September 2026) | Oil supply and prices: The strait remains mostly closed through Q3 2026; global oil inventories continue to draw down, keeping prices elevated through the summer. Brent may stay above US$100/b into Q3 and only begin to fall later in Q4. Demand: High prices and policy measures suppress demand; global GDP growth dips below 2 %. Substitution: Governments intensify efforts to substitute oil with electrification and efficiency. | Energy stocks: Elevated prices support upstream and integrated producers’ earnings through at least Q3 2026, sustaining high cash flows. Midstream and refiners benefit from strong margins and volumes. However, as economic activity slows, markets may start pricing in demand destruction; valuations could peak mid‑year. Shareholder distributions (dividends and buybacks) remain key drivers. Volatility: Stock volatility remains high as investors track negotiation progress. Companies with exposure to renewables or gas‑weighted portfolios may be viewed as defensive hedges. |
Extended Disruption (Strait closed through end‑2026) | Oil supply and prices: Brent prices could approach US$200/b; more than 11 million b/d stays offline and diesel/jet prices near US$300/b. Global oil demand could fall by 6 million b/d in H2 2026. Economic fallout: A global recession (–0.4 % GDP) occurs, and Middle Eastern GDP contracts by about 10.7 %. Accelerated transition: Countries double down on electrification and renewables, boosting investments in LNG, nuclear and renewables. | Energy stocks: Upstream producers enjoy extraordinary cash flows in the short term, potentially pushing share prices even higher despite a deteriorating macro environment. However, a global recession could eventually hit demand for refined products and petrochemicals, compressing margins. Refiners might struggle with both high feedstock costs and weakening demand, while midstream remains supported by long‑term contracts. Investors may start pricing longer‑term demand destruction and accelerate rotation toward low‑carbon energy stocks (nuclear, renewables, grid and battery storage companies). Companies heavily exposed to the Gulf risk supply disruptions and insurance/operational costs. |
Additional Factors Shaping the Outlook
Energy‑transition momentum: Despite the crisis, renewable and nuclear investments continued. Solar PV additions in 2025 suggest that 2026 will witness continued growth in renewable capacity. Nuclear power’s resurgence (12 GW coming online in 2026 and growth of 2.8 %/yr) adds low‑carbon baseload supply. Investors may increasingly favour companies with exposure to renewables, nuclear and grid infrastructure.
Data‑centre and AI‑driven electricity demand: The rise of AI and data centres is driving rapid growth in electricity demand; Goldman Sachs estimates data‑centre demand could grow 160 % by 2030. This trend supports investment in natural‑gas peakers, nuclear and grid‑scale storage—benefiting companies supplying those technologies.
Policy responses: Governments may intervene to protect consumers from high energy prices. The IEA’s Sheltering From Oil Shocks report (March 2026) recommended measures such as emergency stock releases, fuel‑substitution incentives and support for vulnerable households (not accessible for detailed citation). Such interventions can dampen price signals and affect the earnings of energy companies.
Currency and interest‑rate dynamics: Higher energy prices spur inflation and could prompt central banks to tighten monetary policy, affecting valuations across sectors. The Schroders report noted that the European Central Bank warned of potential rate hikes if higher energy prices feed through to inflation.
Regional differences: Energy‑importing countries in Asia and Europe face higher inflation and potential recession, while producers in North America and Latin America benefit from higher export prices. Diverging regional performance implies that companies with diversified geographic exposure may fare differently.
International Energy Agency (IEA). Oil Market Report – June 2026. 17 June 2026. Available at: https://www.iea.org/reports/oil-market-report-june-2026
International Energy Agency (IEA). Global Energy Review 2026. Available at: https://www.iea.org/reports/global-energy-review-2026
International Energy Agency (IEA). Electricity 2026. Available at: https://www.iea.org/reports/electricity-2026
International Energy Agency (IEA). World Energy Investment 2026. Available at: https://www.iea.org/reports/world-energy-investment-2026
International Energy Agency (IEA). Sheltering From Oil Shocks: Measures to Reduce Impacts on Households and Businesses. March 2026. Available at: https://www.iea.org/reports/sheltering-from-oil-shocks
U.S. Energy Information Administration (EIA). Short-Term Energy Outlook (STEO). Available at: https://www.eia.gov/outlooks/steo/
U.S. Energy Information Administration (EIA). Short-Term Energy Outlook: Global Oil Markets. Available at: https://www.eia.gov/outlooks/steo/report/global_oil.php
Oxford Institute for Energy Studies (OIES). Oxford Energy Forum No. 149: The Iran War and the Future of Global Energy Markets. May 2026. PDF available at: https://www.oxfordenergy.org/wpcms/wp-content/uploads/2026/05/OEF-149.pdf. Institute website: https://www.oxfordenergy.org
Wood Mackenzie. Strait Talking: Iran War Scenarios and the Future of Energy. 29 May 2026. Available at: https://www.woodmac.com/horizons/iran-war-scenarios-and-the-future-of-energy/
Wood Mackenzie. Strait of Hormuz Closure Risks Greatest Global Energy Supply Shock in Decades. Press Release. 20 May 2026. Available at: https://www.woodmac.com/press-releases/strait-of-hormuz-closure-risks-greatest-global-energy-supply-shock-in-decades/
Wood Mackenzie. How the Iran War Could Change Energy Markets. 2 April 2026. Available at: https://www.woodmac.com/blogs/the-edge/how-the-iran-war-could-change-energy-markets/
Butters, John. S&P 500 Energy and Utilities Sectors Earnings Previews: Q1 2026. FactSet Insight. 14 April 2026. Available at: https://insight.factset.com/sp-500-energy-and-utilities-sectors-earnings-previews-q1-2026
Schroders. Quarterly Markets Review – Q1 2026. 6 April 2026. Available at: https://www.schroders.com/en-us/us/individual/insights/quarterly-markets-review—q1-2026/
Energy Network Media Group (Shale Magazine). Energy Sector Q1 Performance Dominates Market in 2026. 6 April 2026. Available at: https://shalemag.com/energy-sector-q1-performance-2/
Kaizen Institute. Nuclear Energy: A Global Industrial and Energy Trend Gaining Momentum. 2026. Available at: https://kaizen.com/insights/nuclear-energy-trends-2026/
Mitovich, Jared. Here’s What Worked During a Rough Quarter for Markets. The Wall Street Journal. Available at: https://www.wsj.com/finance/investing/heres-what-worked-during-a-rough-quarter-for-markets-ed4d626c
S&P Dow Jones Indices. S&P 500 Energy Index. Available at: https://www.spglobal.com/spdji/en/indices/equity/sp-500-energy/
Yahoo Finance. Energy Sector. Available at: https://finance.yahoo.com/sectors/energy/
Charles Schwab. Sector Views: Monthly Stock Sector Outlook. Available at: https://www.schwab.com/learn/story/sector-views
J.P. Morgan Global Research. 2026 Market Outlook. Available at: https://www.jpmorgan.com/insights/research/market-outlook
Morningstar. The Best Energy Stocks to Buy. Available at: https://www.morningstar.com/stocks/best-energy-stocks